This site uses cookies. By continuing to browse the site you are agreeing to our use of cookies.
All
Entrepreneur: Latest Articles
Fast Company
stratechery by Ben Thompson
Inc.com
Seth Godin's Blog on marketing, tribes and respect
The Blog of Author Tim Ferriss
The Smart Passive Income Blog
VentureBeat
Printing Services Market Growth, Innovation, ...
May 5, 2025 0
Retinal Disease Therapeutics Market: An Indus...
May 5, 2025 0
Sodium Hypochlorite Market Global Outlook and...
May 5, 2025 0
Not enough freelance work? Here’s how to navi...
May 5, 2025 0
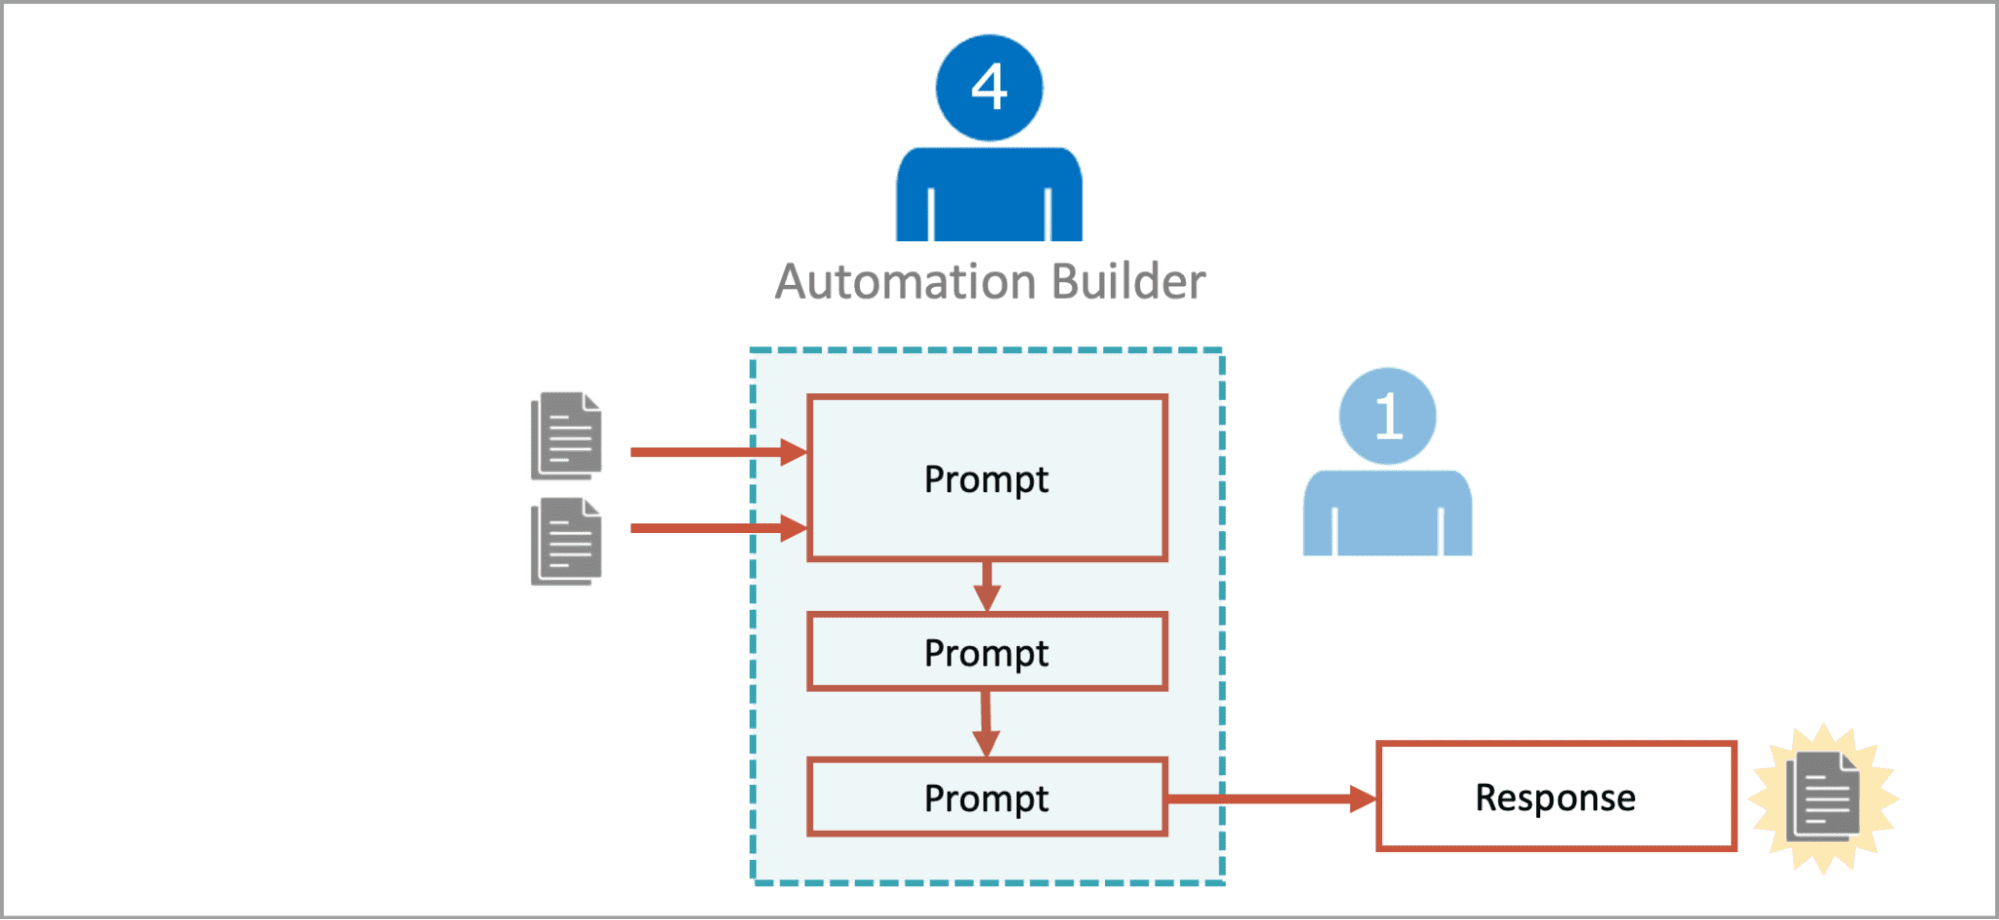
Not everything needs an LLM: A framework for ...
May 3, 2025 0
Carry1st brings Call of Duty: Mobile tourname...
May 3, 2025 0
All
Ask a Manager
Get_Lighthouse
HBS Working Knowledge
Knowledge@Wharton
Management
McKinsey Insights & Publications
MIT Sloan Management Review
OnlyOnce
know-it-all coworker talks over everyone, stu...
May 2, 2025 0
With Millions of Workers Juggling Caregiving,...
Apr 26, 2025 0
Can a Coffee Shop in Utah Help Solve Underemp...
Apr 26, 2025 0
All
Asian Efficiency
Life Optimizer
Lifehack
Lifehacker
Marc and Angel Hack Life
Scott H Young
The Blog of Author Tim Ferriss
The Sweet Setup
Don't Wait: iPhone 12 Still Holds Strong Resa...
Apr 30, 2025 0
Whispering Waves: Soft Light Brown Extensions...
May 2, 2025 0
Sleep – Month-End Update
Apr 30, 2025 0
Outreach – Month-End Update
Apr 26, 2025 0
All
Behance JobList
Freelance Writing Jobs
Freelancer.com - New Projects
NODESK – Remote Jobs
ProBlogger Jobs
VirtualVocations.com
We Work Remotely: Design Jobs
We Work Remotely: DevOps & Sysadmin Jobs
We Work Remotely: Programming Jobs


