


Sellers or buyers housing market? Zillow’s analysis for 250 metros
Want more housing market stories from Lance Lambert’s ResiClub in your inbox? Subscribe to the ResiClub newsletter. Zillow economists have an economic model known as the Zillow Market Heat Index to gauge the competitiveness of housing markets across the country. This model looks at key indicators—including home price changes, inventory levels, and days on market—to generate a score showing whether a market favors sellers or buyers. A higher score indicates a hotter metro-level housing market where sellers have more power. A lower score indicates a colder metro-level housing market where buyers have more power. According to Zillow, a score of 70 or above is a strong sellers market, and a score from 55 to 69 is a sellers market. A score of 44 to 55 indicates a neutral market. A score from 28 to 44 reflects a buyers market, and a score of 27 or below is a strong buyers market. Nationally, Zillow rates the U.S. housing market at 55 for its April 2025 reading, published in May 2025, right on the border between a sellers market and a neutral market. That said, Zillow’s reading varies significantly across the county. Among the 250 largest metro area housing markets, these 10 are the hottest markets, where sellers have the most power, according to Zillow: Rochester, NY: 169 Buffalo, NY: 126 Charleston, WV: 107 Syracuse, NY: 105 Hartford, CT: 97 Albany, NY: 97 Manchester, NH: 93 Anchorage, AK: 86 Boston, MA: 85 Lansing, MI: 85 And these 10 are the coldest markets, where buyers have the most power, according to Zillow: Jackson, TN: 23 Macon, GA: 25 Gulfport, MS: 26 Brownsville, TX: 27 Naples, FL: 27 Cape Coral, FL: 30 Daphne, AL: 30 Panama City, FL: 30 Punta Gorda, FL: 31 Beaumont, TX: 33 5 takeaways on Zillow’s latest assessment Directionally, there’s a lot Zillow gets right. We believe Zillow has correctly identified many regional housing markets where buyers have gained the most leverage—particularly around the Gulf. It also highlights areas where sellers have maintained, relatively speaking, some degree of control, including large portions of the Northeast and Midwest. In ResiClub’s view, Zillow is slightly overstating Northeast and Midwest tightness. While there are still some relatively competitive pockets in those regions, Zillow’s model appears to exaggerate the strength of seller conditions. In the real world, many of these markets feel more neutral or only slightly tilted toward sellers—not full-blown “strong sellers markets” as the model suggests. Zillow also appears to be overstating seller strength on the West Coast. Conditions on the West Coast have clearly softened over the past year, and Zillow’s model doesn’t fully reflect that shift. The softest housing markets right now are Southwest Florida and Central Texas. Based on our own housing market analysis, Florida, in particular, Southwest Florida currently stands out as the softest region in the country, followed by Central Texas markets such as Austin and San Antonio. Zillow’s Market Heat Index is useful—but I believe ResiClub’s monthly reports—especially our inventory analysis across +800 metros and +3,000 counties and our home price analysis across 800+ metros and 3,000+ counties—do a better job of keeping housing stakeholders ahead of market shifts and better informed on current market dynamics. What did this Zillow analysis look like back in spring 2022 at the climax of the pandemic housing boom? Below is Zillow’s April 2022 reading—published in May 2022.
Want more housing market stories from Lance Lambert’s ResiClub in your inbox? Subscribe to the ResiClub newsletter.
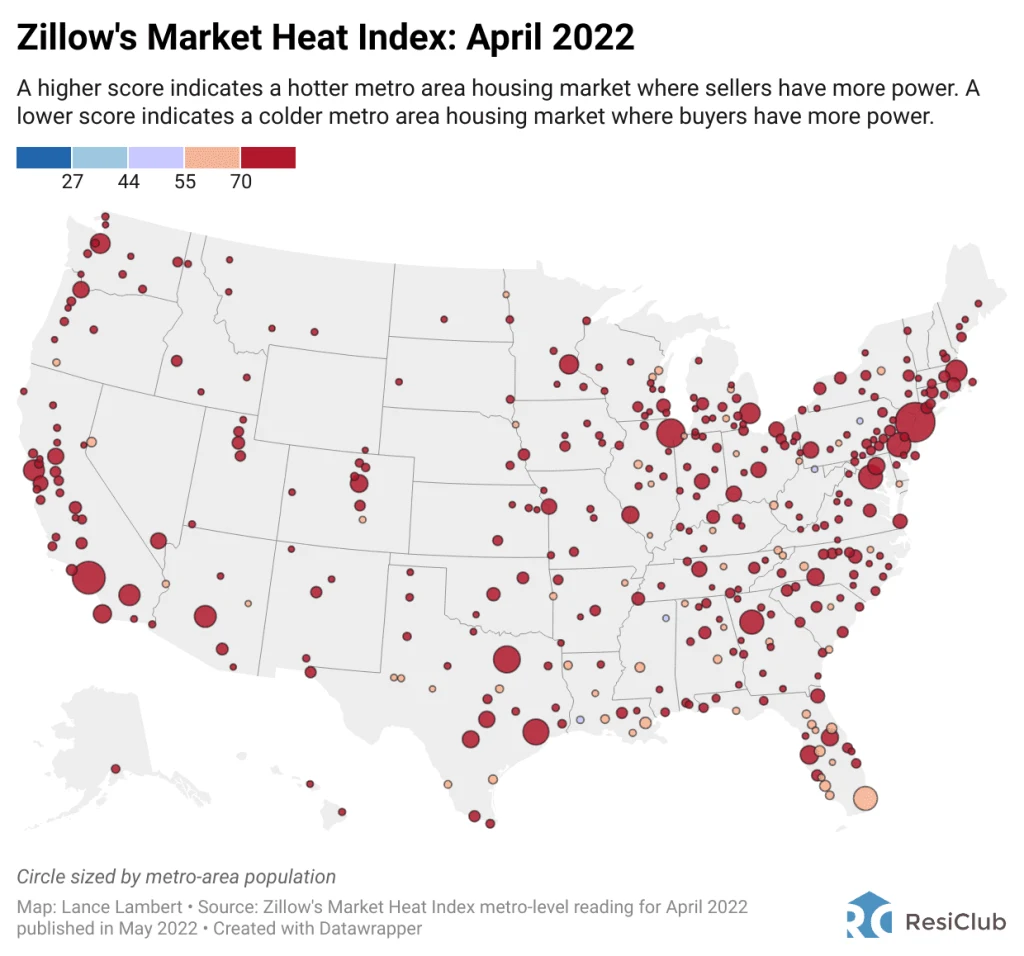
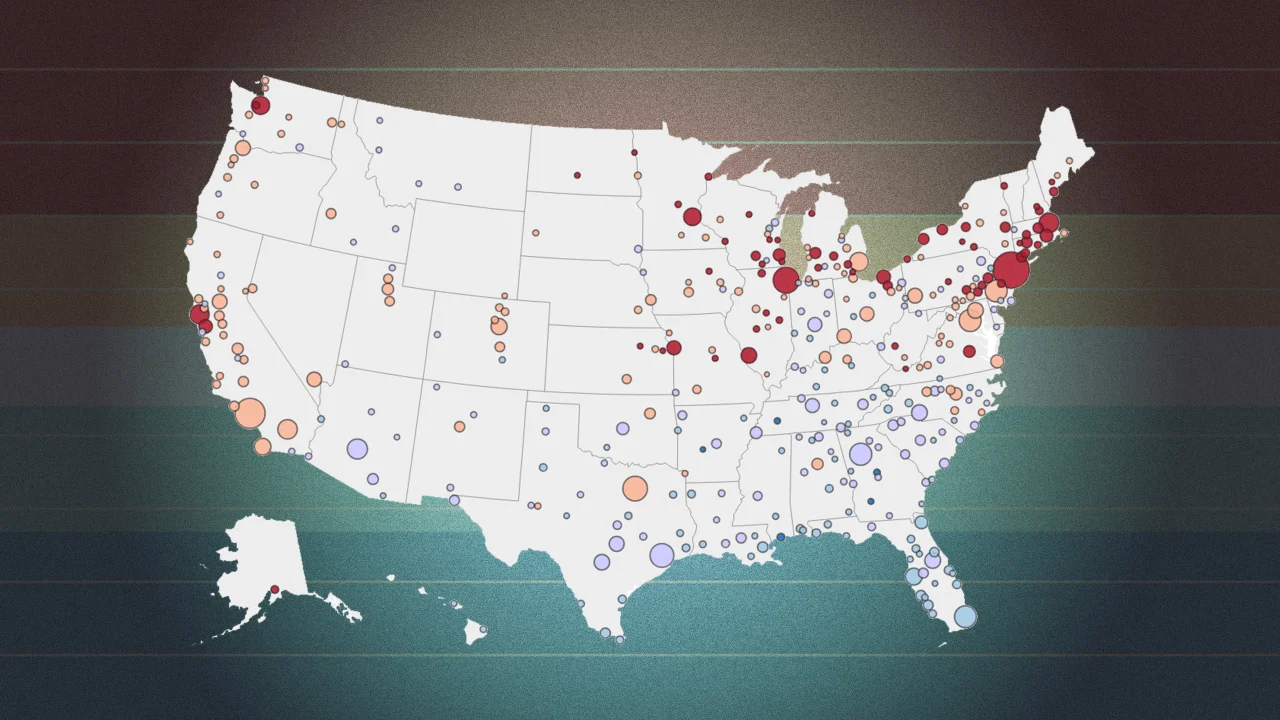
Zillow economists have an economic model known as the Zillow Market Heat Index to gauge the competitiveness of housing markets across the country. This model looks at key indicators—including home price changes, inventory levels, and days on market—to generate a score showing whether a market favors sellers or buyers.
A higher score indicates a hotter metro-level housing market where sellers have more power. A lower score indicates a colder metro-level housing market where buyers have more power.
According to Zillow, a score of 70 or above is a strong sellers market, and a score from 55 to 69 is a sellers market. A score of 44 to 55 indicates a neutral market. A score from 28 to 44 reflects a buyers market, and a score of 27 or below is a strong buyers market.
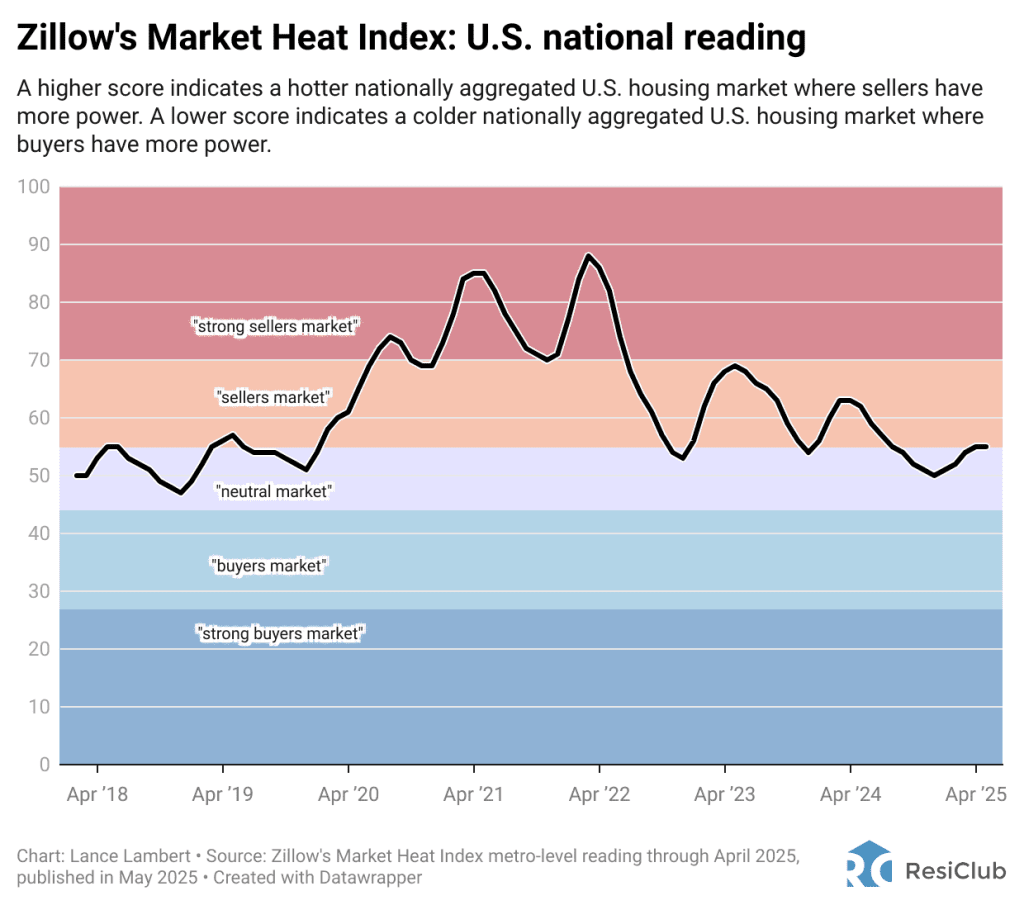
Nationally, Zillow rates the U.S. housing market at 55 for its April 2025 reading, published in May 2025, right on the border between a sellers market and a neutral market. That said, Zillow’s reading varies significantly across the county.
Among the 250 largest metro area housing markets, these 10 are the hottest markets, where sellers have the most power, according to Zillow:
- Rochester, NY: 169
- Buffalo, NY: 126
- Charleston, WV: 107
- Syracuse, NY: 105
- Hartford, CT: 97
- Albany, NY: 97
- Manchester, NH: 93
- Anchorage, AK: 86
- Boston, MA: 85
- Lansing, MI: 85
And these 10 are the coldest markets, where buyers have the most power, according to Zillow:
- Jackson, TN: 23
- Macon, GA: 25
- Gulfport, MS: 26
- Brownsville, TX: 27
- Naples, FL: 27
- Cape Coral, FL: 30
- Daphne, AL: 30
- Panama City, FL: 30
- Punta Gorda, FL: 31
- Beaumont, TX: 33
5 takeaways on Zillow’s latest assessment
- Directionally, there’s a lot Zillow gets right. We believe Zillow has correctly identified many regional housing markets where buyers have gained the most leverage—particularly around the Gulf. It also highlights areas where sellers have maintained, relatively speaking, some degree of control, including large portions of the Northeast and Midwest.
- In ResiClub’s view, Zillow is slightly overstating Northeast and Midwest tightness. While there are still some relatively competitive pockets in those regions, Zillow’s model appears to exaggerate the strength of seller conditions. In the real world, many of these markets feel more neutral or only slightly tilted toward sellers—not full-blown “strong sellers markets” as the model suggests.
- Zillow also appears to be overstating seller strength on the West Coast. Conditions on the West Coast have clearly softened over the past year, and Zillow’s model doesn’t fully reflect that shift.
- The softest housing markets right now are Southwest Florida and Central Texas. Based on our own housing market analysis, Florida, in particular, Southwest Florida currently stands out as the softest region in the country, followed by Central Texas markets such as Austin and San Antonio.
- Zillow’s Market Heat Index is useful—but I believe ResiClub’s monthly reports—especially our inventory analysis across +800 metros and +3,000 counties and our home price analysis across 800+ metros and 3,000+ counties—do a better job of keeping housing stakeholders ahead of market shifts and better informed on current market dynamics.
What did this Zillow analysis look like back in spring 2022 at the climax of the pandemic housing boom? Below is Zillow’s April 2022 reading—published in May 2022.