


![Building A Digital PR Strategy: 10 Essential Steps for Beginners [With Examples]](https://buzzsumo.com/wp-content/uploads/2023/09/Building-A-Digital-PR-Strategy-10-Essential-Steps-for-Beginners-With-Examples-bblog-masthead.jpg)


How to Use GA4 to Track Social Media Traffic: 6 Questions, Answers and Insights [VIDEO]
The post How to Use GA4 to Track Social Media Traffic: 6 Questions, Answers and Insights [VIDEO] appeared first on Orbit Media Studios.
![How to Use GA4 to Track Social Media Traffic: 6 Questions, Answers and Insights [VIDEO]](https://www.orbitmedia.com/wp-content/uploads/2023/06/ab-testing.png)

Social media marketing is hard work.
It takes a lot of time and energy. Connect and share. Listen and engage. Publish and promote. Be consistent.
Usually the list of social media marketing goals includes “brand awareness” and “drive website traffic.” But how well is it working? Which social media channels are bringing in visitors? What are they doing? As soon as you start sharing content on social media, you start asking:
“How do I track social media in Google Analytics?”
Of course, you have all kinds of social media data right in front of you. There are likes, shares, comments and followers. It’s a data-rich channel with tons of metrics. But some of these are the least useful marketing metrics. They don’t necessarily translate into website traffic or engagement.
This post shows the step-by-step process for answering each of these questions using GA4.
- How much traffic comes from social media?
- How does social media traffic compare to other traffic sources?
- Which specific social media channels send the most traffic? The best traffic?
- Which articles get the most traffic from social media?
- Which social media campaigns attract and convert visitors?
- How is paid social traffic different from organic social traffic?
- How is social traffic different for mobile and desktop visitors?
How much social media traffic are we getting?
How does social media traffic compare to other traffic sources?
Acquisition > Traffic acquisition report, set to “Session primary channel groups”
We’ll start with two big questions. They’re easy to answer and the insights are good. Here’s how to see the top-line traffic from social media, relative to your other traffic sources, using some of the most useful metrics in Analytics.
We’ll use the Traffic acquisition report, where “Organic social” is one of the “Session primary channel groups.” Along with Direct, Organic Search, Referral and Email, it’s one of the big buckets.
- From the Reports section go to Acquisition > Traffic acquisition
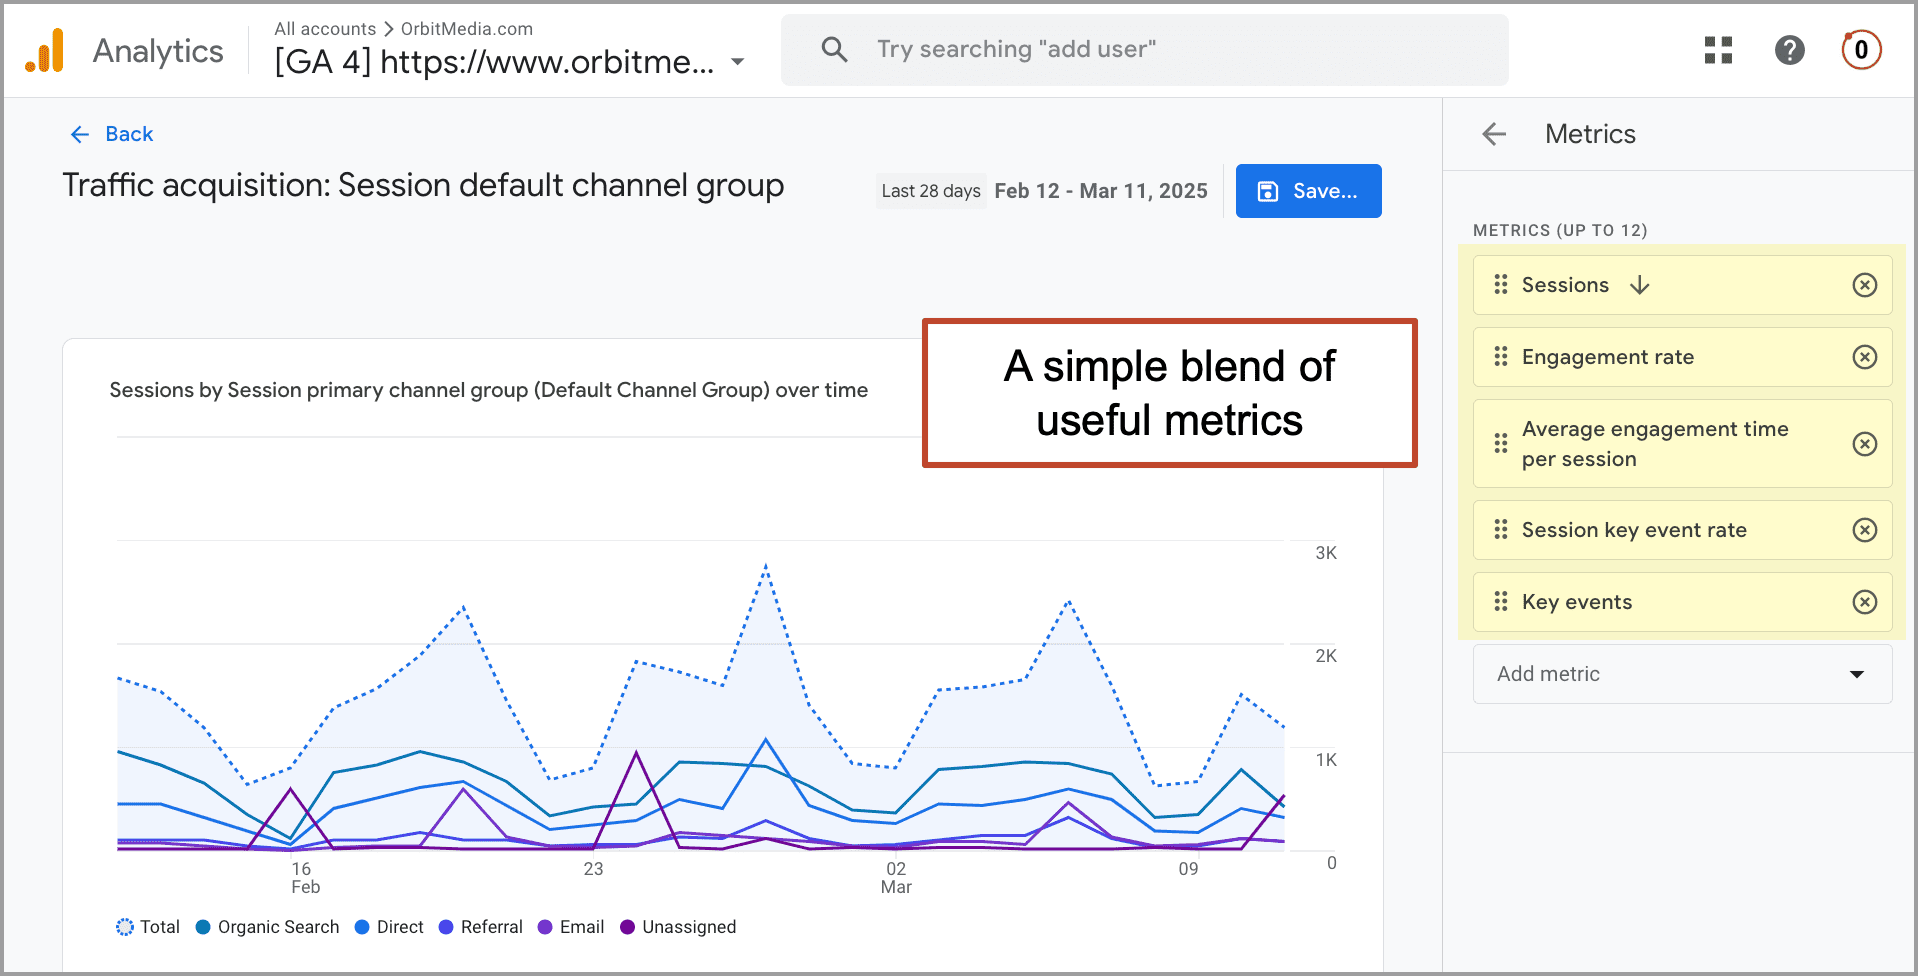
Now let’s customize the report to show the most useful metrics on the right. You’ll need “Editor” or “Administrator” level access.
- Click the pencil icon in the top right to Customize the report. Some options will slide in from the right.
- Click on “Metrics >” and select your favorite metrics, or use my recommendations: Sessions, Engagement rate, Average engagement time per session, Session Key event rate and Key events. That’s it.I think those are the best. They represent the top, middle and bottom of the funnel. I’ll come back to those throughout this post. The default metrics are not very good. Revenue? Do they think we’re all ecommerce companies?Here’s what the customization looks like.
- Click “Apply” in the bottom right
- Save (Save changes to current report), then hit “← Back” in the top left to go back to the newly customized report
Now you are measuring social media traffic, engagement and conversions. You can see how it compares with the other traffic sources.
- How much traffic are we attracting from social media? (users, sessions)
- How engaged are visitors from social media? (engagement rate, avg engagement time)
- How likely are social media visitors to take action? (session conversion rate, conversions)
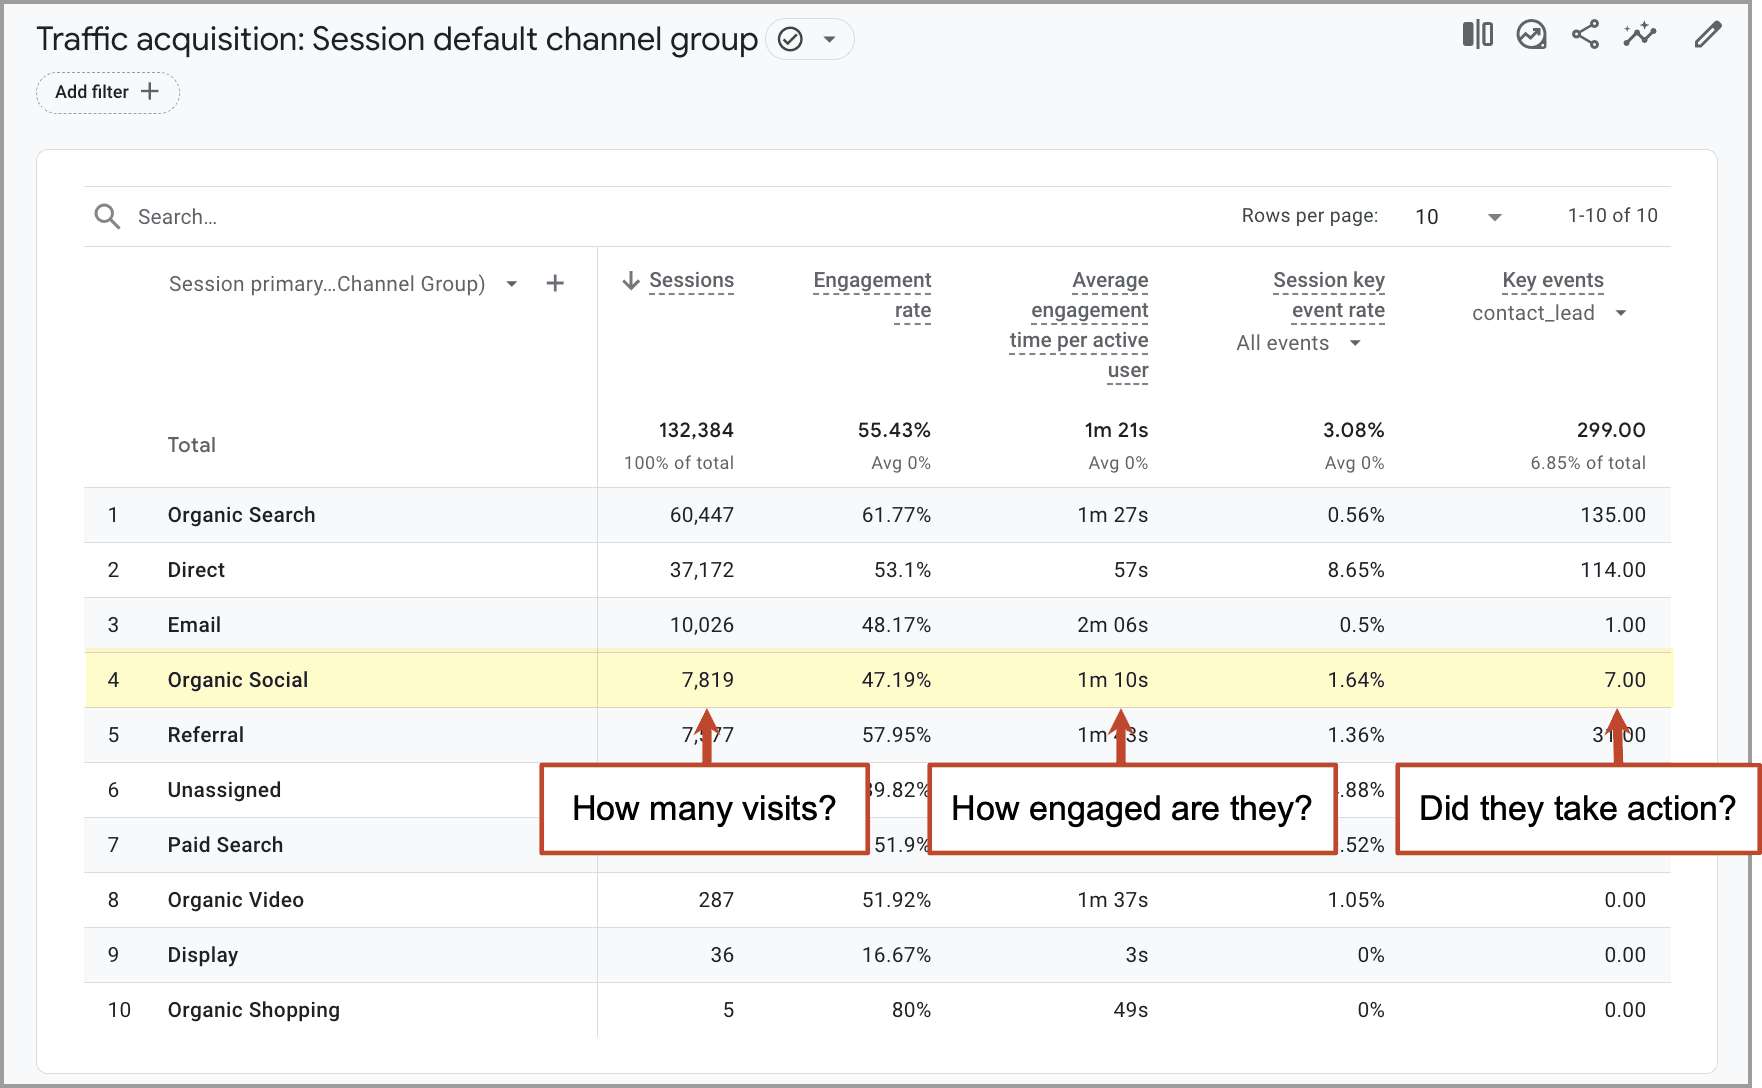
Scroll to the right to see conversions (“key events”) and you can select any of your goals from the drop down.
It looks like over the last three months, I can credit social media with 142 email subscribers but just seven contact form submissions. That’s attribution. Connecting traffic sources to conversions. Keep in mind that GA4 underreports everything.
Don’t be surprised if…
- Conversion rates for visitors from social media are lower than those of the other traffic sources. Social media visitors tend to have lower intent than search or direct traffic visitors.
- The numbers may be very low. Especially Instagram traffic. Set a bigger date range to see more data. Beware of seasonality and changes in marketing activity.
Related: Here’s our guide to website traffic sources if you want the detailed (sometimes surprising) definition of all 18 Default Channel Groups in GA4.
Which social channels send us the most traffic? The best traffic?
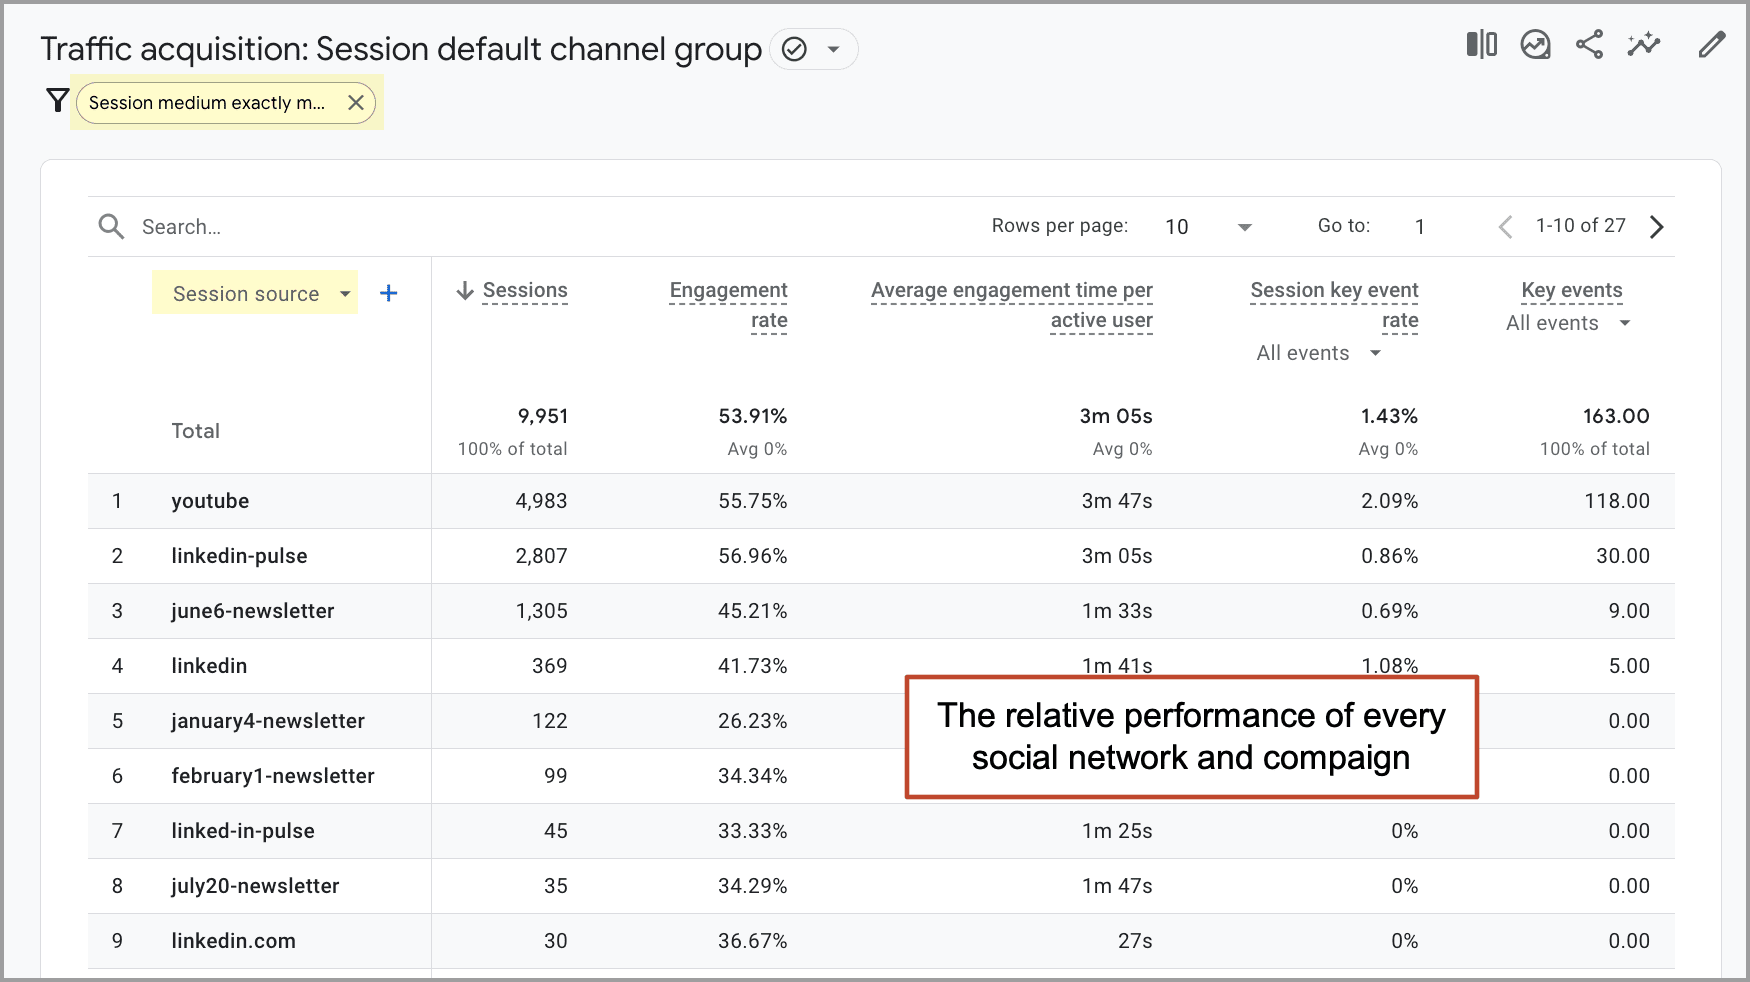
Acquisition > Traffic acquisition report, set to “source” and filtered for social.
Do this from the same report. Just change the dimension in the dropdown above the first column. Switch it from “Default channel group” to “Session source.” Then you can create a filter to show just traffic from the “social” medium.
Here’s the full process:
- From the Reports section go to Acquisition > Traffic acquisition
- Click the pencil icon in the top right to Customize the report. Some options will slide in from the right.
- Click on “Metrics >” and select your favorite metrics, or use my recommendations: Users, Sessions, Engagement rate, Session conversion rate, Average engagement time per session, Event count and Conversions. (see the screenshot above)
- Click “Apply” in the bottom right
- Save (Save changes to current report), then hit “← Back” in the top left to go back to the newly customized report
- In the dropdown above the first column, change the dimension from “Default channel group” to “Source”
- Click “Add filter +” and set the filter to include traffic when the “Session medium” is “social”
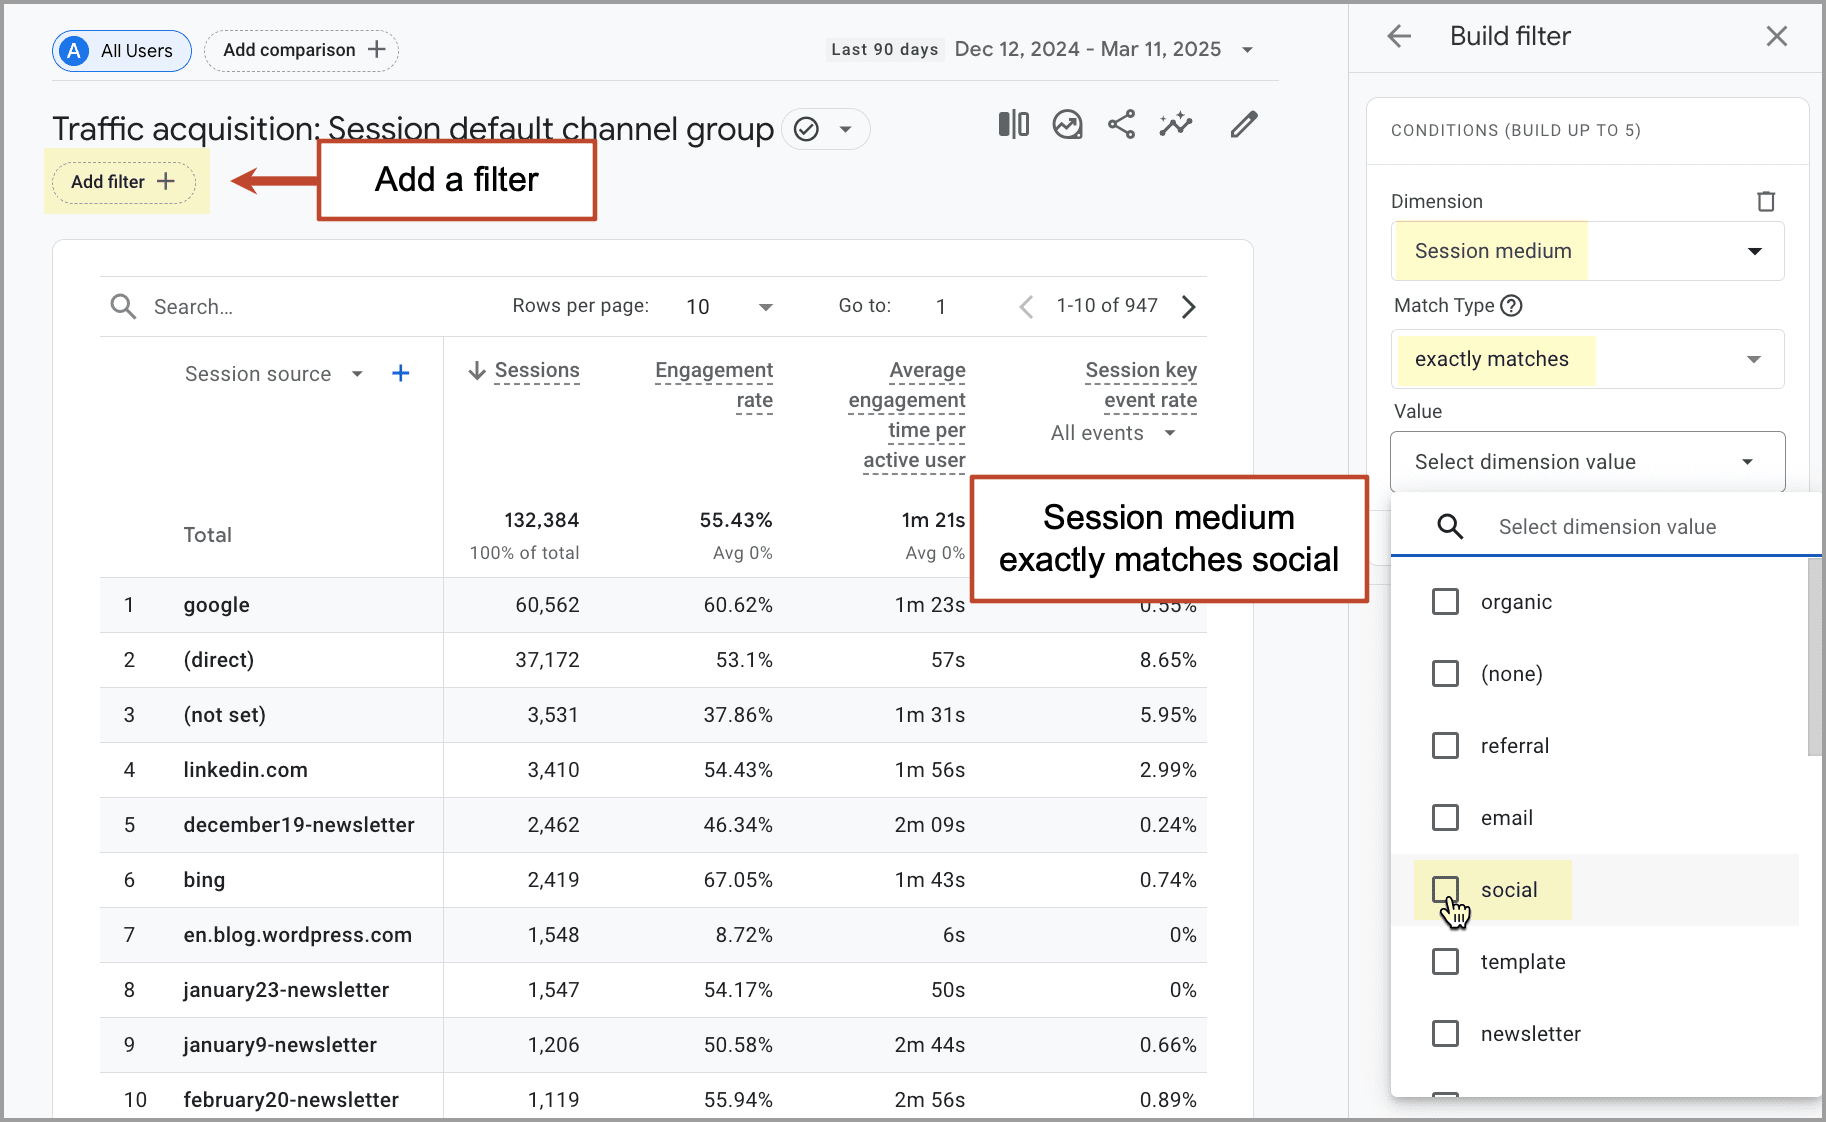
Now you’re looking at a list of social traffic sources, including social media networks (Facebook, LinkedIn, Twitter) and campaigns tagged as social. It’s easy to compare these social traffic sources at a glance.
- Which are attracting more visitors? Notice how some attract a lot more traffic than others.
- Which are attracting more engaged visitors? Notice how some have higher engagement and conversion rates than others?
Quick reminder: Engagement rate is the percentage of visits that were “engaged sessions.” An engaged session is a visit that lasted 10+ seconds, touched 2+ pages or recorded a conversion.  Read More