


NASA flew this new device into Hurricane Helene. It could change the future of storm forecasting
This fall, NASA scientist Kris Bedka flew into Hurricane Helene to test a device that uses lasers to create ultradetailed wind measurements. It could be the key to unlocking better storm predictions. The new device is called the Aerosol Wind Profiler (AWP), and it’s been in the works at NASA for about four years. The AWP uses the Doppler effect to create real-time, 3D maps of wind patterns above the Earth’s surface—data that, before now, has been much more difficult to capture. Bedka is the AWP’s principal investigator at NASA’s Langley Research Center, and he has spent more than 100 hours in the air testing the device in collaboration with the National Oceanic and Atmospheric Administration (NOAA), which runs the National Weather Service (NWS). He believes the AWP could be the missing link in weather agencies’ abilities to accurately map severe weather events like hurricanes and thunderstorms. [Photo: NASA/David C. Bowman] The shortcomings to current wind data collection To create predictions for severe weather phenomena, agencies like the NWS collate a vast swath of data including atmospheric temperature, moisture levels, and pressure patterns, typically pulled from satellite readings. Wind patterns, both on the ground and above ground level, are another piece of assembling the overall puzzle. But when it comes to fitting wind patterns into the model, there are a few limitations. If forecasters need wind measurements close to the Earth, Bedka says, it’s fairly simple to take readings using sensors that can be mounted on the ground. But what’s most important for weather forecasting is “having a sense of the three-dimensional picture of the wind—so winds not just at the ground, but many miles above us, which all combine to drive the weather that we experience at the ground,” he says. Currently, to get a sense of the 3D wind picture, forecasters mainly use weather balloons. These balloons give accurate readings, Bedka says, but there are only around 1,300 launch sites across the globe, meaning their data is fairly limited. Another tool, called geostationary satellites, can use snapshots of cloud cover and atmospheric moisture patterns to calculate wind vectors, but only at the cloud top, meaning that the 3D wind picture is still missing. Many experts believe that tools like the AWP are the “missing link” to address this problem. [Photo: NASA/David C. Bowman] How the AWP uses lasers to make a 3D wind map Before making a detailed 3D wind map, scientists need to understand two main factors: how fast wind currents are moving and in what direction. The AWP does that by tracking the movement of particulates—including tiny pieces of cloud matter, dust, smoke, pollution, and sea salt that are all floating in the atmosphere—to see how wind is buffeting them at a given moment in time. To capture the movement of those particulates, the AWP is mounted to an aircraft with viewing ports underneath it. From there, the instrument emits 200 pulses of laser energy per second toward the atmosphere in two opposite directions, where they scatter and reflect off the particulate matter. This scattering causes a measurable change in the laser pulse wavelength, also known as the Doppler effect. “You’ve probably heard of the Doppler effect before, and you’ve experienced it yourself,” Bedka says. “You hear an ambulance coming towards you, and at one particular distance, it sounds very high pitched, and then as it comes by you and then goes away from you, you hear the pitch change—that’s due to the Doppler effect. A Doppler wind lidar kind of behaves in an analogous way.” In simple terms, the altered “frequencies” of laser light that bounce back from particulates give the AWP the information needed to calculate wind speed and direction, even measuring conditions at different altitudes in the atmosphere simultaneously. All of those details can then be stitched together to create a complete 3D wind map. [Photo: NASA/Maurice Cross] The AWP flies through Hurricane Helene In 2022, Bedka says, NOAA solicited new technologies for accurate wind measurement, which had been an ongoing challenge for the agency when trying to predict severe weather. Since Bedka’s team had just wrapped up their AWP prototype, they proposed an aircraft flight campaign that would validate the tool’s effectiveness. NOAA agreed to fund the proposal, and last fall, Bedka took flight for over 100 hours in a kind of flying laboratory, installed inside a 1970s-era DC-8 aircraft. The lab came outfitted with NASA’s AWP and its High-Altitude Lidar Observatory (HALO), another tool built to measure water vapor, aerosols, and cloud properties. Over the course of the flight campaign, AWP and HALO worked together to create ultradetailed 3D maps of wind patterns and aerosol layers. Bedka was aiming to collect data from as wide a range of weather conditions as possible—and, as it happened, that included Hurricane Helene. Be
This fall, NASA scientist Kris Bedka flew into Hurricane Helene to test a device that uses lasers to create ultradetailed wind measurements. It could be the key to unlocking better storm predictions.
The new device is called the Aerosol Wind Profiler (AWP), and it’s been in the works at NASA for about four years. The AWP uses the Doppler effect to create real-time, 3D maps of wind patterns above the Earth’s surface—data that, before now, has been much more difficult to capture.
Bedka is the AWP’s principal investigator at NASA’s Langley Research Center, and he has spent more than 100 hours in the air testing the device in collaboration with the National Oceanic and Atmospheric Administration (NOAA), which runs the National Weather Service (NWS). He believes the AWP could be the missing link in weather agencies’ abilities to accurately map severe weather events like hurricanes and thunderstorms.
The shortcomings to current wind data collection
To create predictions for severe weather phenomena, agencies like the NWS collate a vast swath of data including atmospheric temperature, moisture levels, and pressure patterns, typically pulled from satellite readings. Wind patterns, both on the ground and above ground level, are another piece of assembling the overall puzzle.
But when it comes to fitting wind patterns into the model, there are a few limitations. If forecasters need wind measurements close to the Earth, Bedka says, it’s fairly simple to take readings using sensors that can be mounted on the ground. But what’s most important for weather forecasting is “having a sense of the three-dimensional picture of the wind—so winds not just at the ground, but many miles above us, which all combine to drive the weather that we experience at the ground,” he says.
Currently, to get a sense of the 3D wind picture, forecasters mainly use weather balloons. These balloons give accurate readings, Bedka says, but there are only around 1,300 launch sites across the globe, meaning their data is fairly limited. Another tool, called geostationary satellites, can use snapshots of cloud cover and atmospheric moisture patterns to calculate wind vectors, but only at the cloud top, meaning that the 3D wind picture is still missing. Many experts believe that tools like the AWP are the “missing link” to address this problem.
How the AWP uses lasers to make a 3D wind map
Before making a detailed 3D wind map, scientists need to understand two main factors: how fast wind currents are moving and in what direction. The AWP does that by tracking the movement of particulates—including tiny pieces of cloud matter, dust, smoke, pollution, and sea salt that are all floating in the atmosphere—to see how wind is buffeting them at a given moment in time.
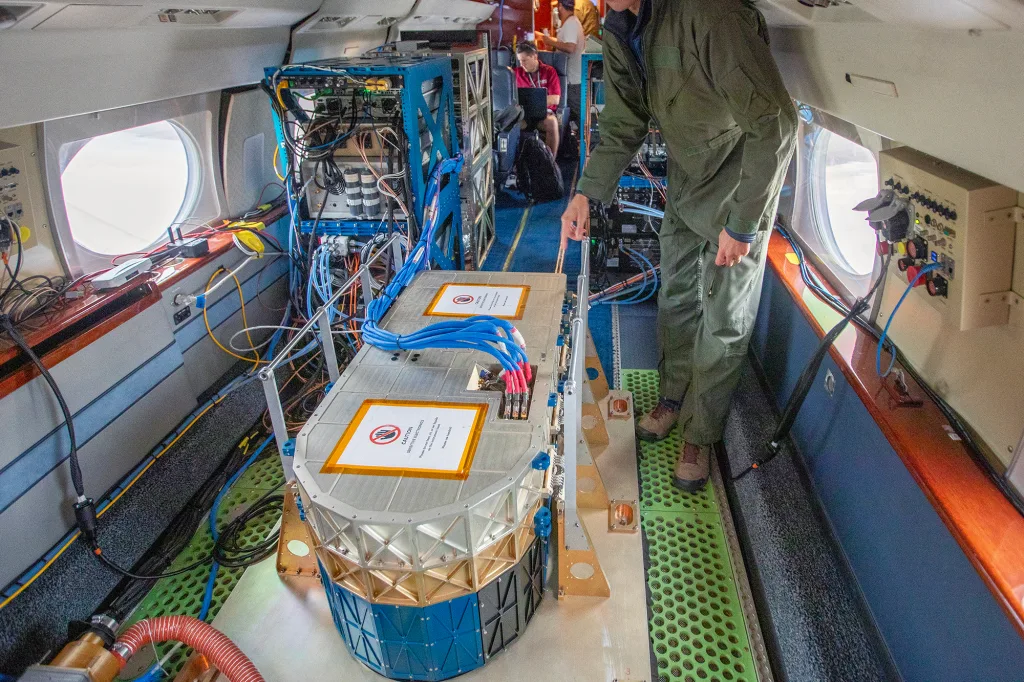
To capture the movement of those particulates, the AWP is mounted to an aircraft with viewing ports underneath it. From there, the instrument emits 200 pulses of laser energy per second toward the atmosphere in two opposite directions, where they scatter and reflect off the particulate matter. This scattering causes a measurable change in the laser pulse wavelength, also known as the Doppler effect.
“You’ve probably heard of the Doppler effect before, and you’ve experienced it yourself,” Bedka says. “You hear an ambulance coming towards you, and at one particular distance, it sounds very high pitched, and then as it comes by you and then goes away from you, you hear the pitch change—that’s due to the Doppler effect. A Doppler wind lidar kind of behaves in an analogous way.”
In simple terms, the altered “frequencies” of laser light that bounce back from particulates give the AWP the information needed to calculate wind speed and direction, even measuring conditions at different altitudes in the atmosphere simultaneously. All of those details can then be stitched together to create a complete 3D wind map.
The AWP flies through Hurricane Helene
In 2022, Bedka says, NOAA solicited new technologies for accurate wind measurement, which had been an ongoing challenge for the agency when trying to predict severe weather. Since Bedka’s team had just wrapped up their AWP prototype, they proposed an aircraft flight campaign that would validate the tool’s effectiveness.
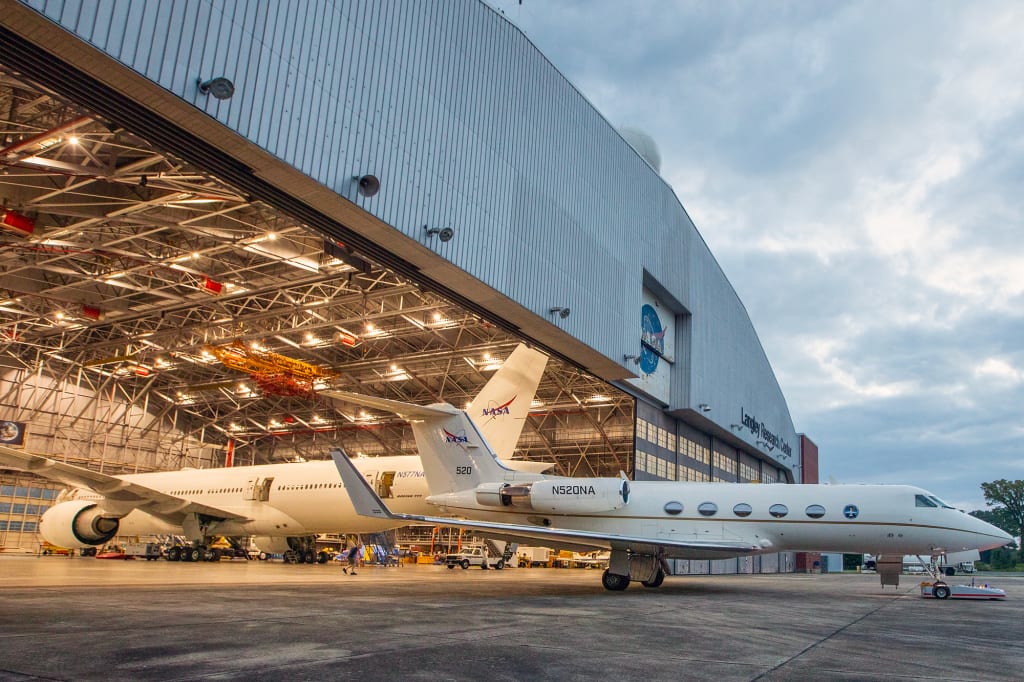
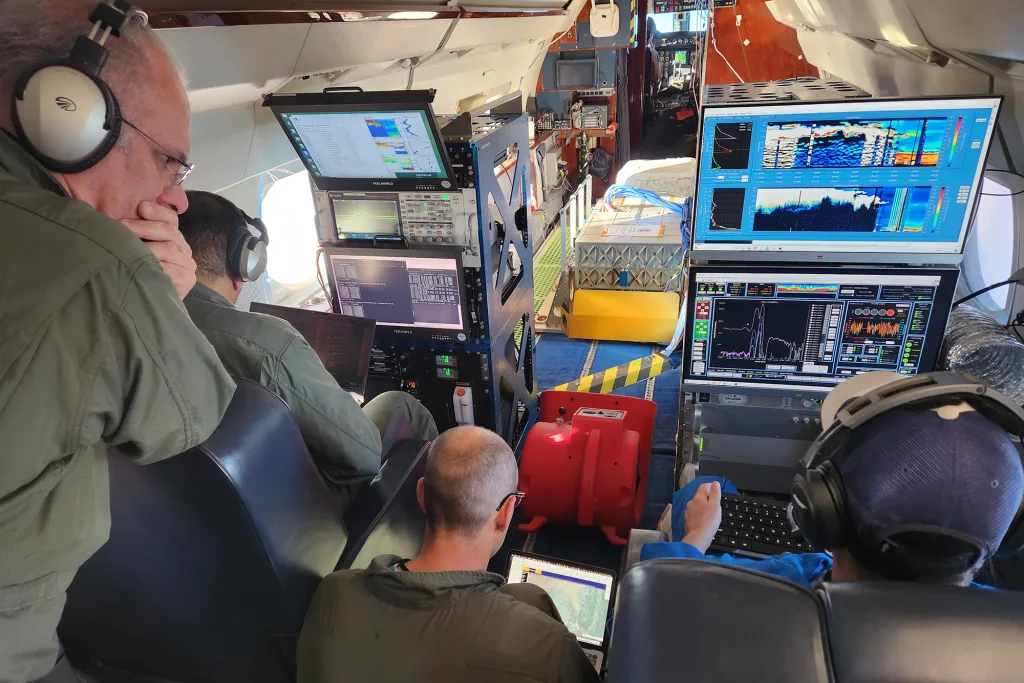
NOAA agreed to fund the proposal, and last fall, Bedka took flight for over 100 hours in a kind of flying laboratory, installed inside a 1970s-era DC-8 aircraft. The lab came outfitted with NASA’s AWP and its High-Altitude Lidar Observatory (HALO), another tool built to measure water vapor, aerosols, and cloud properties. Over the course of the flight campaign, AWP and HALO worked together to create ultradetailed 3D maps of wind patterns and aerosol layers. Bedka was aiming to collect data from as wide a range of weather conditions as possible—and, as it happened, that included Hurricane Helene.
Because Helene was a relatively well-predicted storm, Bedka’s team had time to plan a flight route that would allow the AWP to measure “as close to the storm center and the highest winds that were available to us.” Given the plane’s limited six-hour flight range, Bedka and the crew flew through the edges of the hurricane in several legs on September 26, traveling down the western edge of the storm, going around the eye in the Gulf of Mexico, and heading back up the East Coast. In all, it took about nine hours.
Bedka, who has flown in several NASA aircrafts through intense thunderstorms, says the conditions were choppy but not too severe. During the hurricane flight, his team was able to collect a rich database of wind measurements that proved the AWP’s potential effectiveness during severe weather.
What’s next for the AWP
For now, the AWP is just in testing phases, but NASA is currently working to make it more widely available.
That would involve bringing on an agency or commercial partner, like NOAA, willing to invest further in the technology—ideally, by adapting it for use on smaller satellites rather than flying it up on planes. Currently, the AWP is about the size of a coffee table, but to fit on a vessel set for space, researchers would need to shrink it to about one-tenth its current size, Bedka says. (According to a NASA spokesperson, the AWP project hasn’t been impacted by federal budget and staff cuts at NASA and NOAA.)
Ideally, NASA would be able to create a “constellation” of AWP’s orbiting the Earth that could measure winds simultaneously all across the globe. With such a wide swath of data, prediction models for extreme weather would become significantly more accurate.
“Severe storms don’t just pop up just out of the clear blue sky on a random day,” Bedka says. “They form because all the ingredients align in order to make them become as intense as they are. What we’re trying to do with this technology is to measure the winds with as much spatial and vertical detail as permitted by laser technology. We’ve already found that when this data is put into weather prediction models, it has a really big impact.”